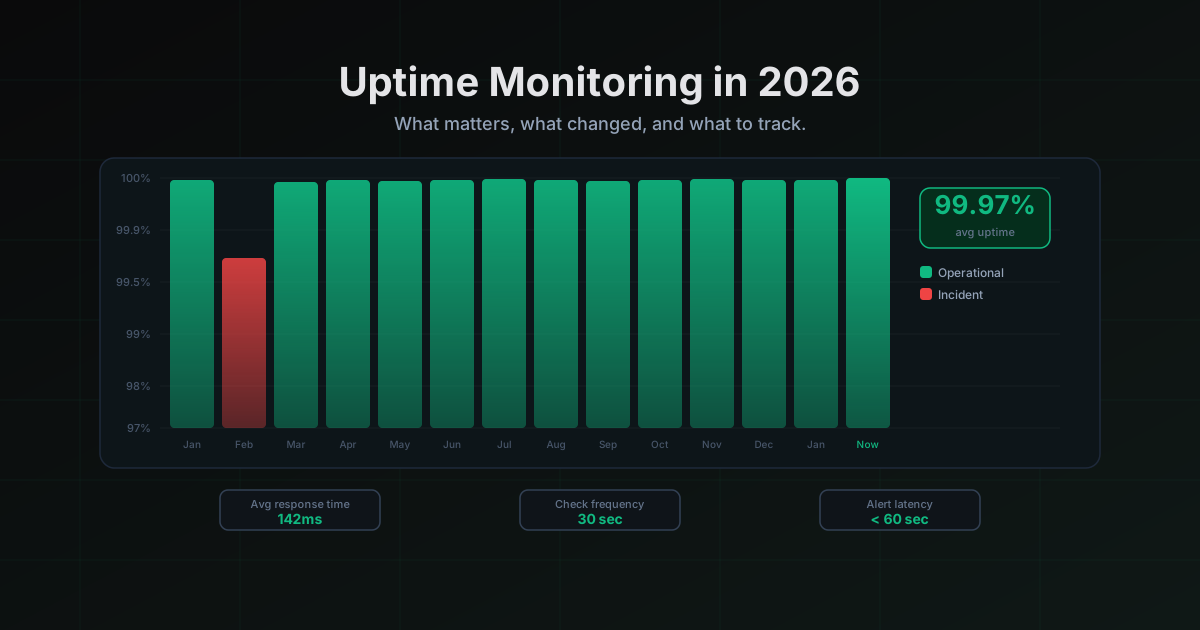
Uptime Monitoring in 2026: What Every DevOps Team Should Track
The essential uptime monitoring metrics every DevOps team should track in 2026, from TTFB and error rates to SSL expiry and DNS resolution, plus practical alerting thresholds.
Your site went down at 3 AM last Thursday. Nobody noticed until a customer tweeted about it four hours later. Your on-call engineer checked the dashboard, saw everything green, and said "looks fine to me." It wasn't fine. The health check endpoint returned 200 while the actual login flow was broken for every user on the West Coast.
This happens because most teams still monitor the wrong things, at the wrong intervals, from the wrong locations. Uptime monitoring in 2026 is not just "does the server respond to a ping." It's a layered system that catches real problems before your customers do.
Here's what actually matters.
The five metrics that matter
Response time (not just availability)
A 200 status code means nothing if the response takes 14 seconds. Your site is "up" in the technical sense and completely unusable in the practical sense. Users don't wait. Google doesn't wait. Your SLA probably defines availability as "responding within acceptable latency," not just "responding."
Track P50, P95, and P99 response times for every monitored endpoint. P50 tells you what the typical user experiences. P95 catches the slow tail that affects 1 in 20 requests. P99 catches the outliers that turn into support tickets.
Set your baseline during a normal week, then alert when P95 drifts more than 50% above that baseline. If your typical P95 is 400ms and it hits 600ms, something changed. You want to know before it hits 2 seconds.
Time to First Byte (TTFB)
TTFB measures the time between the client sending a request and receiving the first byte of the response. It isolates your server-side processing from network transfer time. A degraded TTFB with normal total response time might mean nothing. A normal total response time with a degraded TTFB means your server is struggling but the response itself is small enough to mask it.
In 2026, Google uses TTFB as part of its Core Web Vitals assessment. A TTFB over 800ms will hurt your search ranking. For APIs, anything over 200ms on a simple endpoint suggests a problem worth investigating, whether it's a slow database query, a cold function start, or a misconfigured cache.
Monitor TTFB separately from total response time. They degrade for different reasons and the fix is different for each.
Error rate
Individual errors happen. A single 502 is noise. But if 3% of your requests are returning 5xx errors, you have a problem that a simple up/down check will never catch, especially if your health check endpoint sits on a different code path than your actual application.
Track error rates as a percentage of total requests, not as absolute counts. A service handling 10,000 requests per minute with 50 errors (0.5%) is healthy. A service handling 100 requests per minute with 50 errors (50%) is on fire. Absolute error counts don't tell you which situation you're in.
Alert at 1% error rate for warnings, 5% for critical. These thresholds work for most web applications. Adjust them based on your specific tolerance, but start there.
SSL certificate expiry
SSL certificates expire. When they do, browsers show a full-screen warning that tells your customers the site might be trying to steal their data. This is not a graceful degradation. This is a complete loss of trust, instantly, for every visitor.
Modern DevOps monitoring checks SSL expiry proactively. Alert at 30 days before expiry, then again at 14 days, then daily inside 7 days. If you're using Let's Encrypt with auto-renewal, you still need this check. Auto-renewal fails silently more often than you think, usually because of a DNS change, a firewall rule, or a container rebuild that lost the renewal hook.
Certificate transparency logs, chain validation, and protocol version checks are all part of a complete SSL monitoring setup. Your monitoring should verify that the certificate chain is complete, the cert matches the domain, and TLS 1.2+ is enforced.
DNS resolution time
DNS is the invisible dependency. When it's slow, everything is slow. When it's broken, everything is broken, and the error messages are confusing enough that your team might spend 30 minutes debugging the application before someone thinks to check DNS.
Monitor DNS resolution time from multiple locations. Healthy DNS resolution takes 10-50ms. If you're seeing 200ms or more, your DNS provider might be having issues, your TTL settings might be wrong, or DNSSEC validation might be failing.
Also monitor for DNS propagation after changes. If you update an A record and half your users still hit the old IP 12 hours later, your TTL is too high or propagation is failing in specific regions. Multi-region DNS monitoring catches this before your customers do.
Check frequency: 60 seconds vs. 5 minutes
The default monitoring interval for most tools is 5 minutes. That means if your site goes down right after a check, it takes up to 5 minutes to detect it. For a lot of services, that's fine. For anything customer-facing or revenue-critical, it's not.
Here's the practical breakdown:
60-second checks are right for:
- Production APIs that customers interact with directly
- Checkout and payment flows
- Authentication endpoints
- Any endpoint covered by an SLA with teeth
5-minute checks are fine for:
- Internal tools and dashboards
- Staging environments
- Marketing sites with low traffic
- Non-critical microservices that have upstream retry logic
The cost difference between 60-second and 5-minute monitoring is real but usually small. You're trading a few extra dollars per month for 4 minutes of faster detection on your most important endpoints. For most teams, that trade is worth it on the 5-10 endpoints that actually matter, with 5-minute intervals on everything else.
Don't monitor everything at 60 seconds. Do monitor your critical path at 60 seconds.
Multi-region monitoring: why one location isn't enough
If you monitor from a single location, you're testing one network path. Your site could be unreachable from Asia, slow from Europe, and perfectly fine from the Virginia data center where your monitoring runs.
Multi-region monitoring catches:
- CDN failures in specific regions. Your CDN might be serving stale content or returning errors from one POP while others are fine. Single-location monitoring will never see this.
- DNS propagation issues. After a DNS change, some regions resolve to the new IP immediately while others hold the old record. If your old server is already decommissioned, those users get a connection refused error.
- Routing problems. BGP issues, submarine cable problems, and regional peering disputes are more common than most teams realize. They cause degraded performance or complete outages in specific geographies while the rest of the world sees nothing wrong.
- Latency baseline differences. What's fast from US-East might be slow from Sydney. Multi-region monitoring gives you per-region latency baselines so you can set appropriate thresholds for each geography.
At minimum, monitor from three regions: one near your primary infrastructure, one in the geography where most of your users are, and one that represents your furthest user base. If you're serving a global audience, five to seven check locations covers the major network paths.
Setting alerting thresholds that don't cause alert fatigue
Bad thresholds are worse than no monitoring. If your team gets 50 alerts a day and 48 of them are false positives, they stop reading alerts. Then alert 49 is a real outage and nobody responds for 20 minutes because "it's probably nothing."
Set thresholds based on actual baselines, not arbitrary numbers. Run your monitoring for two weeks with alerting turned off. Look at the data. Find your normal variance. Then set thresholds above that variance.
A practical starting framework:
| Metric | Warning | Critical |
|---|---|---|
| Response time (P95) | 50% above baseline | 200% above baseline |
| TTFB | > 500ms | > 1,000ms |
| Error rate | > 1% | > 5% |
| SSL expiry | 30 days | 7 days |
| DNS resolution | > 100ms | > 500ms |
Use consecutive failure counts before alerting. A single slow response is not an incident. Three consecutive slow responses from the same region might be. Five consecutive failures from multiple regions definitely is.
Route warnings to a dashboard or a low-priority Slack channel. Route critical alerts to PagerDuty or your on-call rotation. Never route warnings to PagerDuty. Your on-call engineer's sleep matters.
Tying monitoring to your status page
Monitoring data in isolation lives in a dashboard that your team checks occasionally. Monitoring data connected to a public status page turns detection into communication automatically.
The best workflow looks like this: monitoring detects a problem, it triggers an alert to your engineering team, and simultaneously updates your status page so customers know before they need to ask. No manual steps. No "someone remember to update the status page" message in Slack that gets lost in the noise.
This is where LiveStatus fits. It connects your uptime monitoring directly to a branded status page that your customers can check. When response times degrade or error rates spike, your status page reflects reality instead of showing "all systems operational" while your Twitter mentions fill with complaints.
LiveStatus supports 60-second check intervals, multi-region monitoring, and the full set of metrics described above. SSL expiry monitoring, DNS checks, and configurable alerting thresholds are built in, not bolted on. You can set per-endpoint thresholds and route alerts to Slack, email, PagerDuty, or webhooks.
The pricing starts at a level that works for teams of any size, including a free tier for smaller projects. And because LiveStatus includes a mobile app, your on-call engineer can acknowledge incidents and post updates from their phone at 3 AM without opening a laptop.
What to do next
If you're starting from zero, here's the priority order:
- Identify your critical path. What are the 5-10 endpoints that, if broken, mean your customers can't use your product? Monitor those at 60-second intervals from at least three regions.
- Set baselines before thresholds. Run monitoring for two weeks. Look at the data. Set thresholds based on reality, not guesses.
- Connect monitoring to a status page. Your monitoring data should automatically inform your customers when something is wrong. Manual status updates don't scale and they're always late.
- Add the secondary metrics. SSL expiry, DNS resolution, and TTFB monitoring catch the problems that basic up/down checks miss.
- Review and tune monthly. Your traffic patterns change. Your infrastructure changes. Thresholds that made sense in January might cause alert fatigue by April. Revisit them regularly.
You can set up LiveStatus in under five minutes and have multi-region uptime monitoring with a public status page running before your next standup. The best monitoring setup is the one you actually ship, not the perfect one you plan to build someday.
More posts
The Best BetterStack Alternative in 2026: LiveStatus
Looking for a BetterStack or Statuspage alternative? LiveStatus gives you beautiful status pages and uptime monitoring without the enterprise price tag.
Why Every API Provider Needs a Status Page
API providers without a status page are leaving developer trust on the table. Here's what a proper API status page does, what it covers, and why it reduces your support load while your incidents are still in progress.
How a Status Page Cuts Support Tickets by 40%
The math behind how a status page reduces support ticket volume during incidents. Email subscribers, SMS alerts, proactive communication, and why the ROI shows up in your support metrics within the first incident.